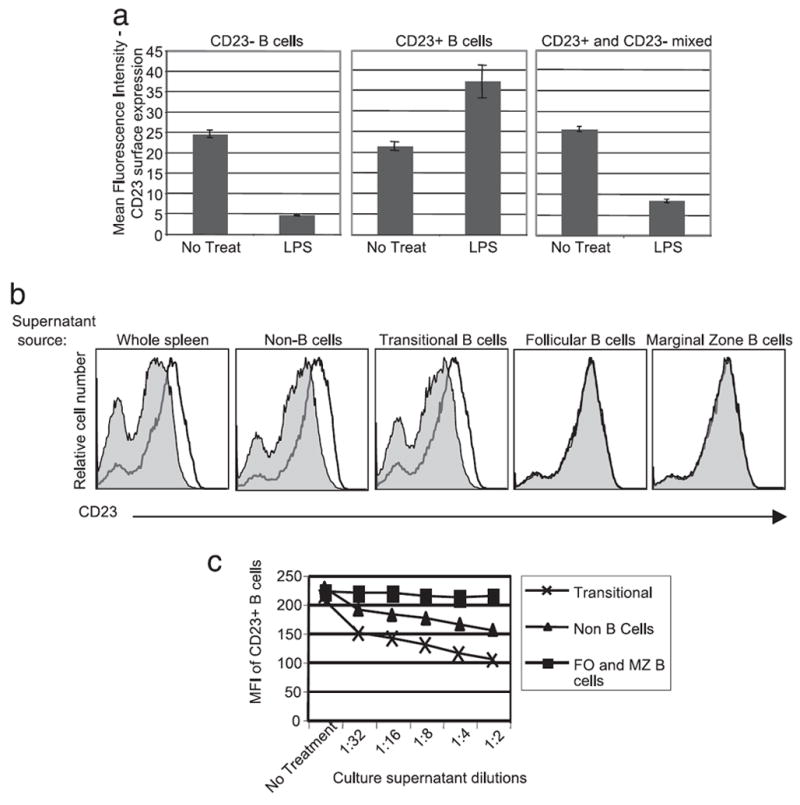
FIGURE 5.

Transitional 1 and non-B cells produce MMP9 in response to LPS treatment. a, CD23 surface expression was determined by flow cytometry 24 h after LPS treatment of the indicated B cell populations. b, Culture supernatants from LPS treated (filled line) or nontreated (solid line) C57BL/6 isolated splenic populations (shown on top of the histograms) were assayed for CD23 cleaving activity as in Fig. 4. Shown are histograms of supernatant treated MyD88−/− B cells. c, LPS-treated culture supernatants from the indicated isolated populations were assayed as in Fig. 4 and data presented as mean CD23 expression by supernatant treated MyD88−/− B cells.
