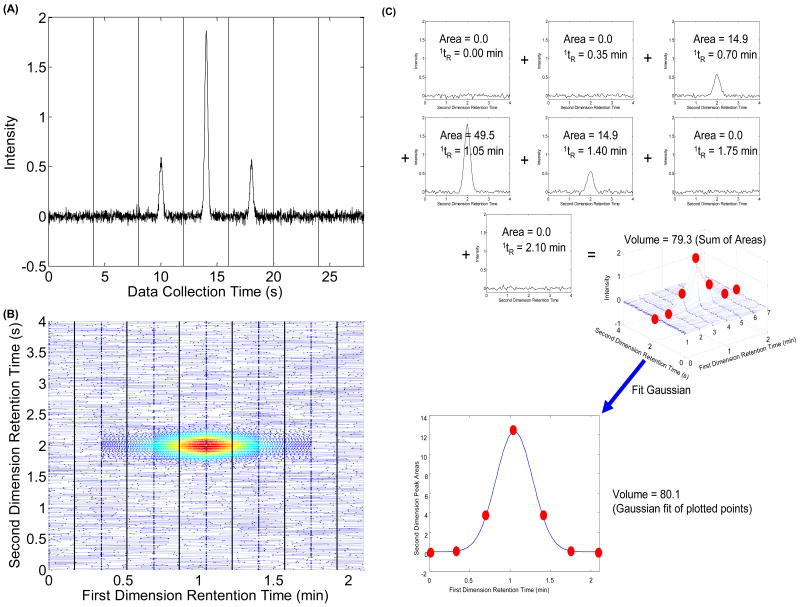
Fig. 1.
(A) Simulated sequential second dimension chromatograms for a single component. The vertical lines in this figure denote the point of injection from the first dimension column onto the second dimension column; (B) A contour plot of this same simulated data; (C) Demonstration of how to sum the second dimension chromatogram areas to generate the volume of a LC×LC peak and of the fitting the second dimension peak areas to the Gaussian model to reconstruct the first dimension chromatogram and subsequently to obtain the volume of the two-dimensional peak. The numbers 1–6 in the mesh plot correspond to the sequential ‘slices’ or second dimension chromatograms. This figure corresponds to the 1σ = 0.20 min (MR = 2.29), tR = 1.05 min case shown in Table 2.

