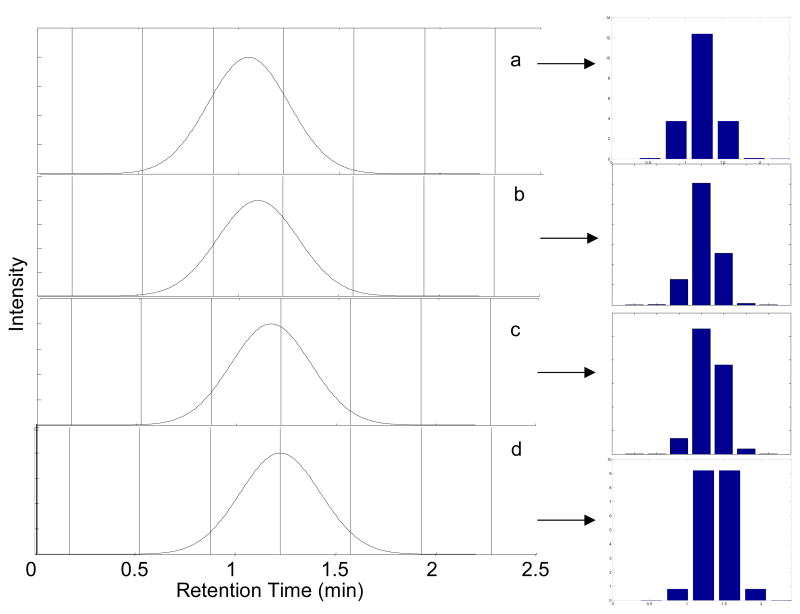
Fig. 3.
The effect of first dimension sampling phase on the series of second dimension peak areas. Sampling period is set at 0.35 min for peaks with a first dimension retention times and sampling phases of (a) 1.050 min (φ = 0), (b) 1.100 min (φ = −0.286π), (c) 1.175 min (φ = −0.714π), and (d) 1.225 min (φ = −π). 1σ = 0.20 min (MR = 2.29). The vertical lines indicate the start and stop of the accumulation intervals. The bar graphs to the right show the relative amount of analyte injected onto the second dimension column upon sample collection at the indicated vertical lines.

