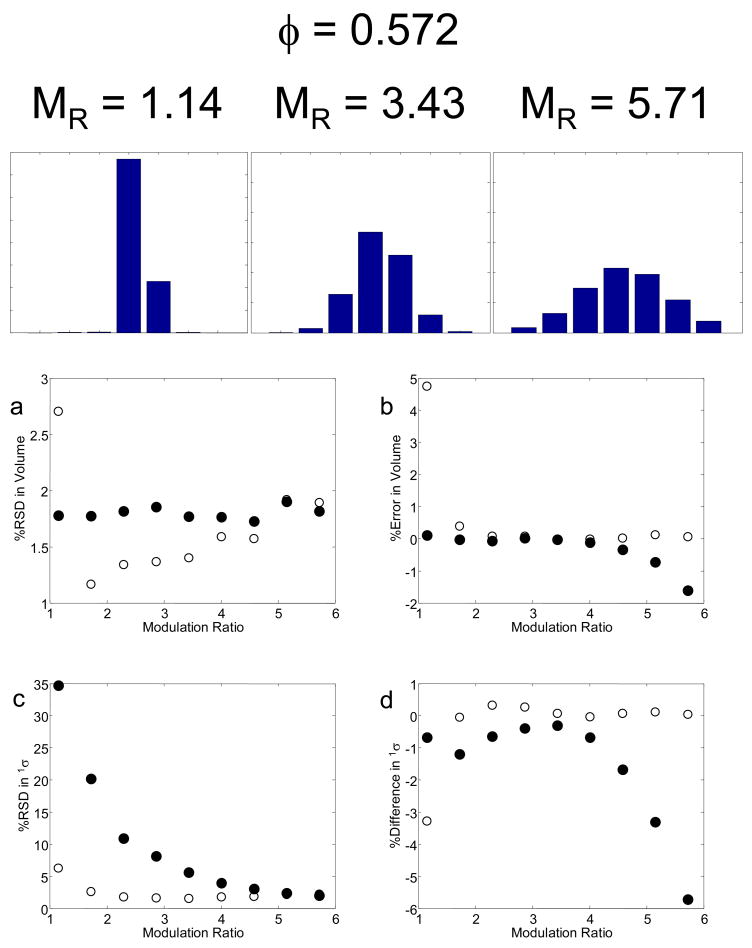
Fig. 6.
The effect of MR on peak metrics. Results of the moments and Gaussian fit method are given as filled (●) and open circles (○), respectively: (a) % RSD in peak volume; (b) % error in peak volume; (c) % RSD in 1σ; (d) % difference in 1σ relative to that calculated by eq. 4.

