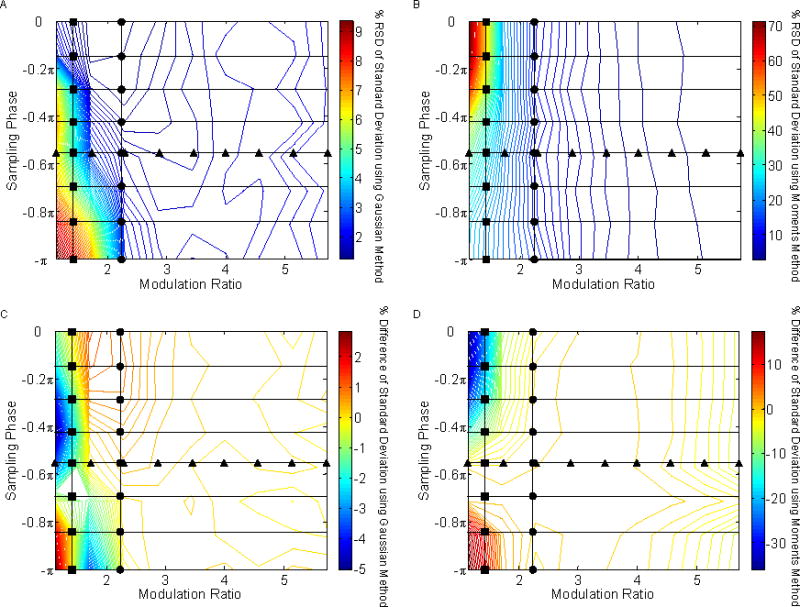
Fig. 9.

The effect of sampling phase (φ) and modulation ratio (MR) on the precision and accuracy of peak width determination.. The circles (●) and triangles (▲) represent the values previously shown in Figs. 4 and 6. (A) %RSD of peak volume using the Gaussian method; (B) %RSD of peak volume using the moments method; (C) % error of peak volume using the Gaussian method; (D) % error of peak volume using the moments method.
