
Fig.4. Ultrastructural changes in IECs in the ECMO intestine.
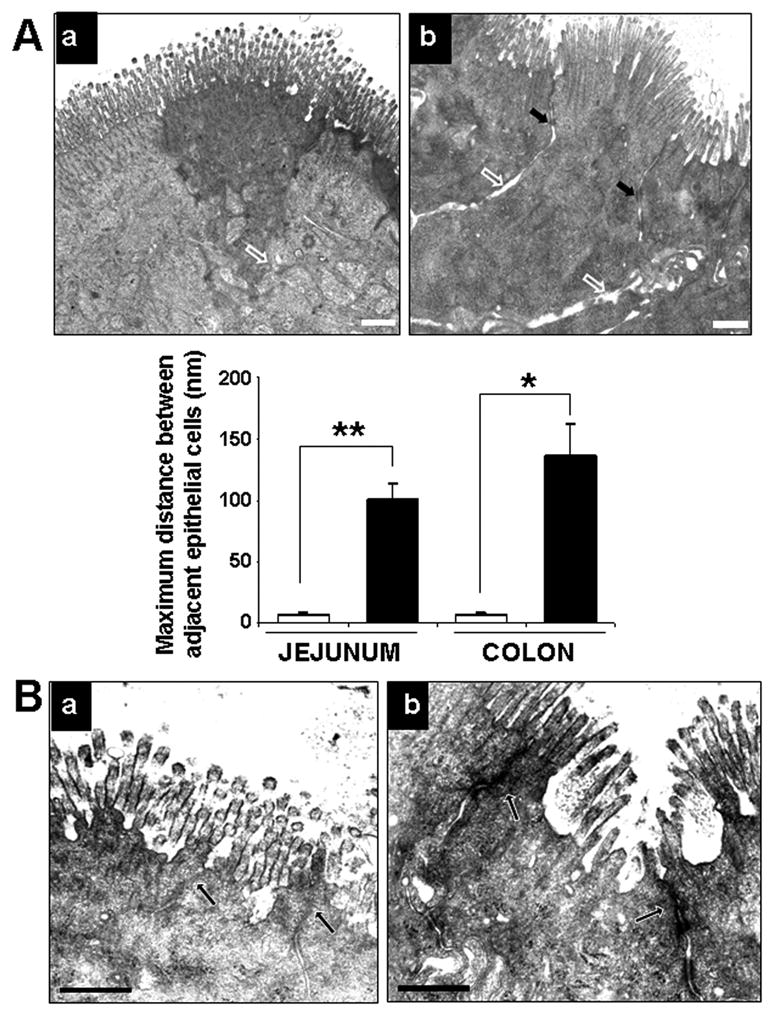
A. Loss of intercellular apposition in IECs in the ECMO intestine: Transmission electron micrographs (TEMs) of (a) sham and (b) ECMO intestine showing increased separation of IECs after 2 hours of ECMO (open arrows), except at desmosome sites (black arrows). Bar diagram (means ± standard error) on the lower left summarizes the distances between adjacent epithelial cells in sham and ECMO intestine. Distance bar represents 500 nm. Data include junctions in 2 villi (or colonic crypts) in 3 randomly chosen areas. * indicates p<0.01, ** indicates p<0.001. B. Increased junctional permeability in the ECMO intestine: TEMs of (a) sham and (b) ECMO intestine show increased penetration of the electron-dense dye ruthenium red in the ECMO intestine (arrows). Distance bar represents 500 nm.