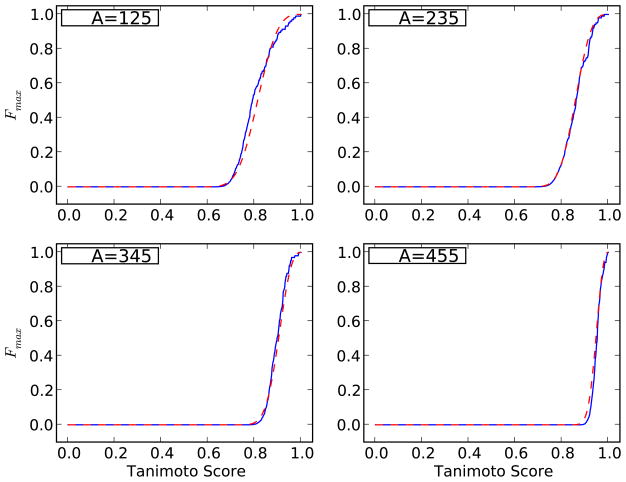
Figure 12.
Cumulative extreme value distribution Fmax(t) computed on a random sample of D = 100,000 molecules from the ChemDB, conditioned on different values of A, using 100 query molecules at each value of A. The solid blue curve represents the values obtained using Equation 50 applied with the empirical distribution F(t) of the scores. The dashed red line shows the corresponding Weibull distribution obtained using the polynomial fit for the parameters σ and ξ as a function of A (solid red line in Figure 11).

