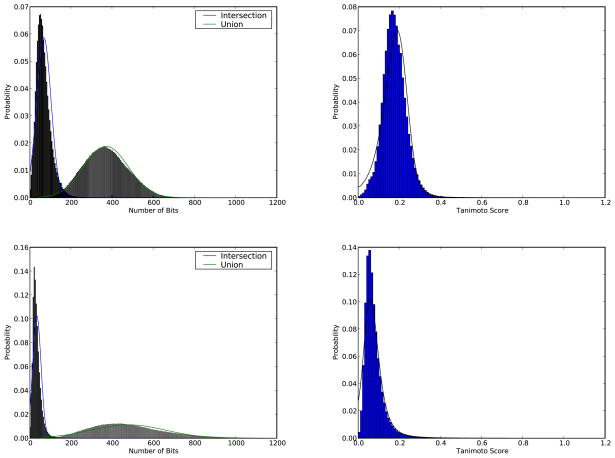
Figure 2.
Results obtained with 100 molecules randomly selected from ChemDB used as queries against a sample of 100,000 molecules randomly selected from ChemDB. The two upper figures correspond to fingerprints of length 1,024 with modulo OR lossy compression, while the two lower figures correspond to fingerprints with lossless compression (equivalent to uncompressed fingerprints). The figures in the left column display the histograms of the sizes of the intersections and unions and their direct Normal approximations in blue and green respectively. The figures in the right column display the histograms of the Tanimoto scores (blue bars), while the solid black line shows the corresponding approximation derived using the ratio of correlated Normal random variables approach.

