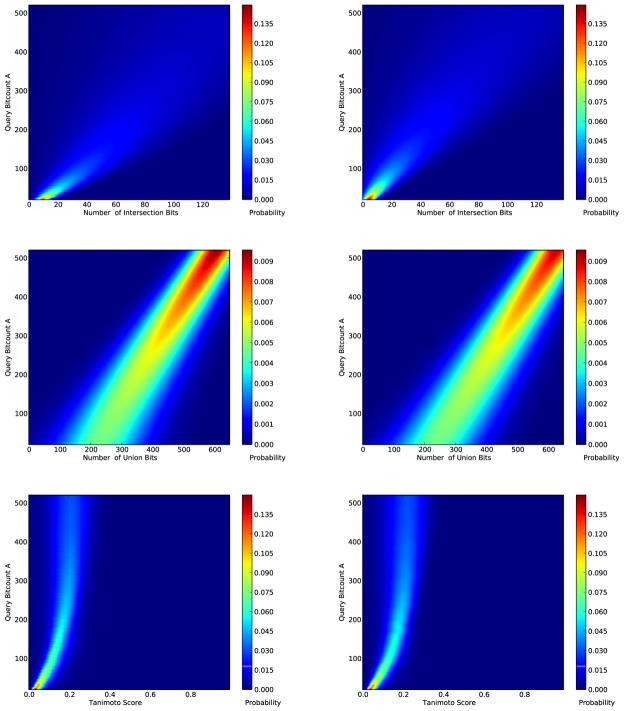
Figure 3.
Empirical (left) and predicted (right) heat maps corresponding to the distribution of the intersections (top), unions (middle), and Tanimoto scores (bottom). The distribution is conditioned on the size of the query molecule, A, shown on the vertical axis. The empirical results are obtained by using for each A 100 molecules randomly selected from the molecules in ChemDB with size A. The theoretical results of the intersection and union distributions use the Conditional Normal Uniform model. At each value of A, the mean and variance of the intersection and union are obtained from Equations 29, 30, 33, and 36 respectively. The theoretical score distribution is a result of the ratio of correlated Normal random variables approximation given by Equations 2–6

