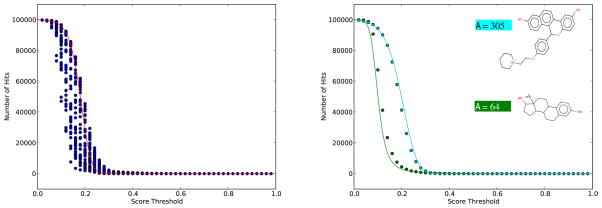
Figure 7.
Left: 55 Estrogen Receptor ligands are used to query a sample of 100,000 molecules randomly selected from the ChemDB. Horizontal axis represents Tanimoto threshold scores. Vertical axis represents number of scores above the threshold (hits). Each dot represents a query’s number of hits above the corresponding threshold on the horizontal axis. Superimposed dots are indistinguishable (see text). The solid red line represents the predicted E-values based on the ratio of two correlated Normal random variables approximation integrated over all values of A in the sample. Right: Dots associated with the Estrogen Receptor ligand with the largest A (cyan) and the smallest A (green) are isolated. The solid lines show predicted E-values based on the ratio of two correlated Normal random variables conditioned on the size of the two query molecules: A = 305 (cyan) and A = 64 (green).

