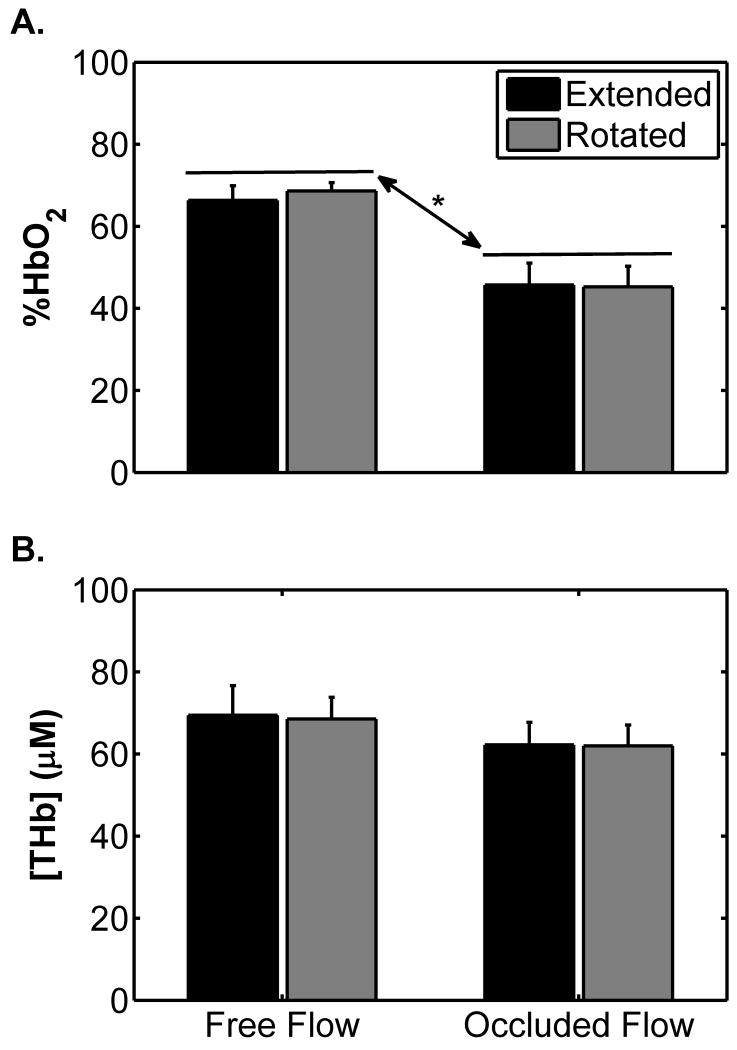
Figure 1.
Mean near infrared spectroscopy-measured %HbO2 (A) and [THb] (B) levels by leg position with and without cuff occlusion for the leg rotation protocol. Error bars indicate the SE. The asterisk (*) indicates a difference between mean %HbO2 levels between free flow and occluded flow conditions (p = 0.002); there was not a significant difference between positions (p=0.58) and the position×occlusion interaction was not significant (p=0.22). For [THb], there was not a significant difference between positions (p = 0.82) or due to occlusion (p=0.09) and the position × cuff occlusion interaction was not significant (p = 0.82).

