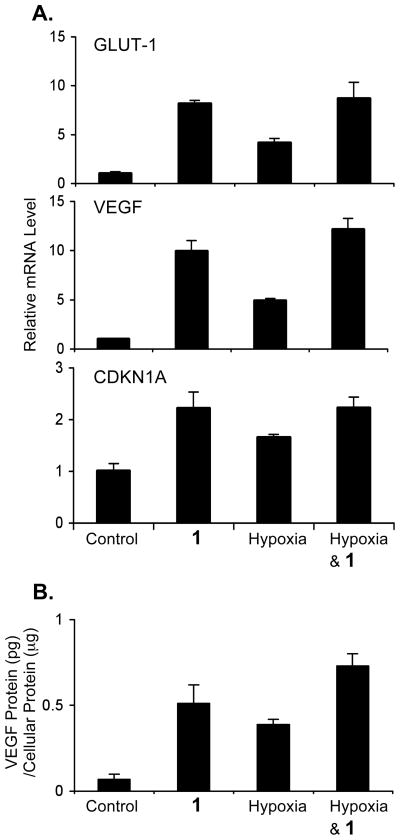
Figure 2.
Compound 1 induces HIF-1 target gene expression in T47D cells under normoxic conditions. Quantitative real time RT-PCR analysis of GLUT-1, VEGF, and CDKN1A mRNA levels upon treatment with 1 (100 μM), hypoxia (1% O2), and both for 16 h (A). The data (mean ± SD) are normalized to an internal control (18S rRNA) and the relative expression level determined by the ΔΔCT method.26 The levels of VEGF proteins in whole cell lysate were determined by ELISA and normalized to the amount of protein (B). The treatments are the same as (A). Bars represent standard deviation from one representative experiment performed in triplicate.

