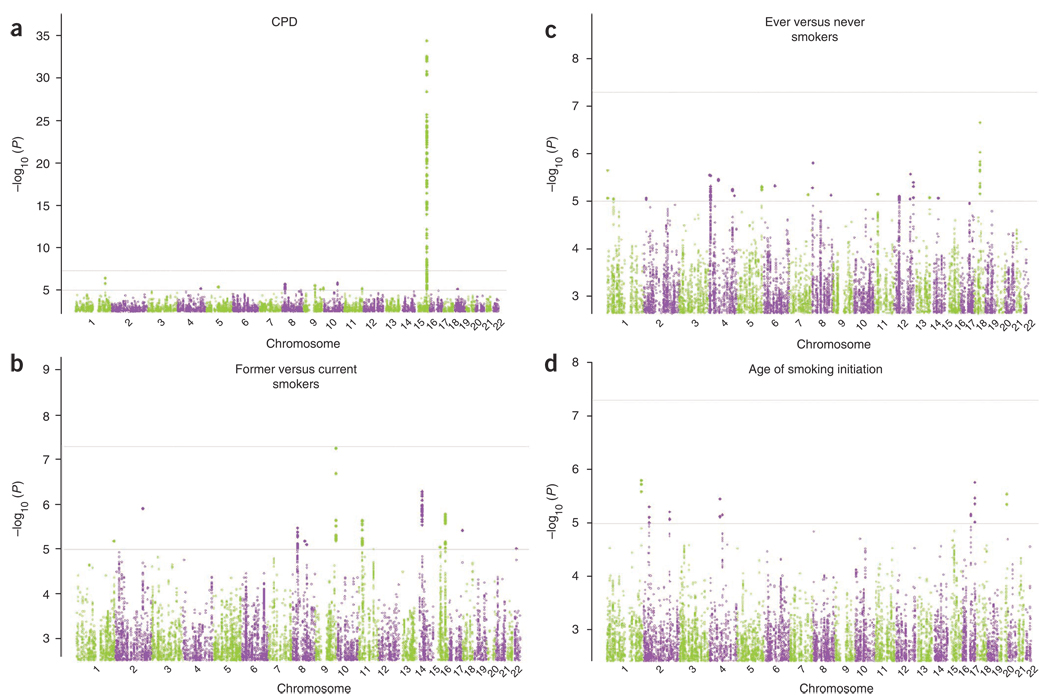
Figure 1.
Genome-wide association results for the TAG Consortium. Manhattan plots showing significance of association of all SNPs in the TAG Consortium meta-analyses for four smoking phenotypes. (a–d) Manhattan plots show SNPs plotted on the x axis according to their position on each chromosome against, on the y axis (shown as −log10 P value), the association with CPD (a), former versus current smoking (b), ever versus never smoking (c) and age of smoking initiation (d).

