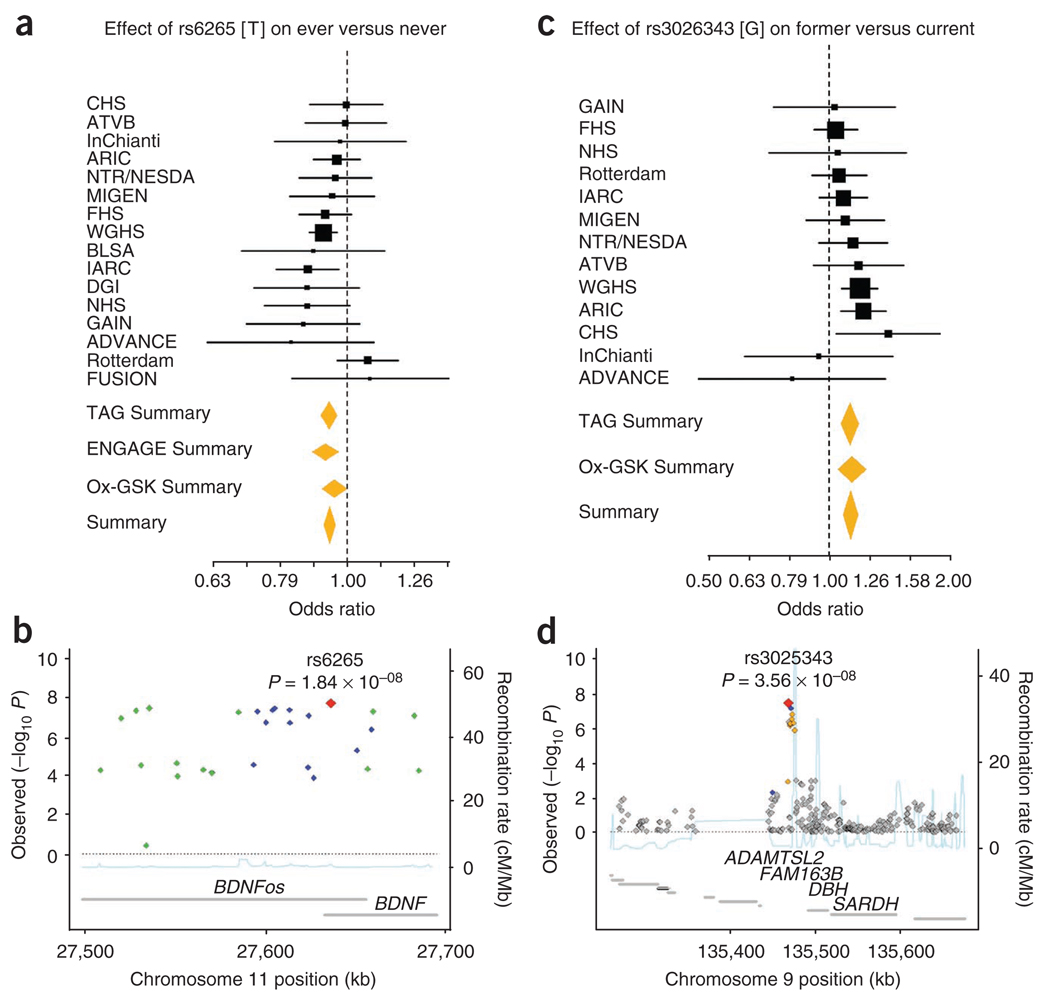
Figure 3.
Forest and regional plots of significant associations for smoking behavior. (a–d) Shown are plots for smoking initiation (a,b) and smoking cessation (c,d) from meta-analyses of the TAG, Ox-GSK and ENGAGE consortia. Regional association plots show SNPs plotted by position on the chromosome against −log10 P value with each smoking phenotype. Estimated recombination rates (from HapMap-CEU) are plotted in light blue to reflect the local LD structure on a secondary y axis. The SNPs surrounding the most significant SNP (red diamond) are color coded to reflect their LD with this SNP (using pairwise r2 values from HapMap CEU): blue, r2 ≥ 0.8–1.0; green, 0.5–0.8; orange, 0.2–0.5; gray, <0.2. The gray bars at the bottom of the plot represent the relative size and location of genes in the region.

