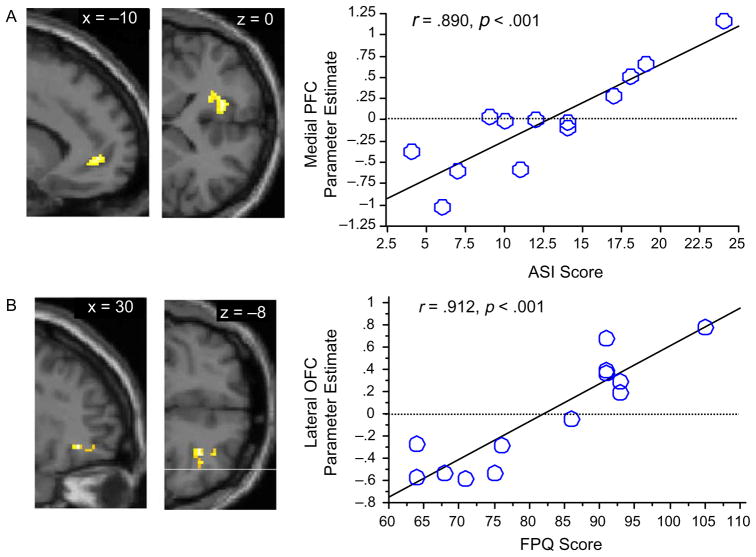
Fig. 2.
Regions identified in regression analyses (see Tables 2 and 3) whose activation during pain correlates P<.001 with individual differences in either anxiety sensitivity or fear of pain shown on canonical T1 anatomical images: (A) Sagittal (left) and axial (right) views of left MPFC region correlated (r=.890) with ASI scores; (B) Sagittal (left) and axial (right) views of right lateral orbital frontal region correlated (r=.912) with FPQ scores. Scatter-plots illustrate these correlations. See Table 3 for correlations of these regions with STAI scores.

