
Figure 4.
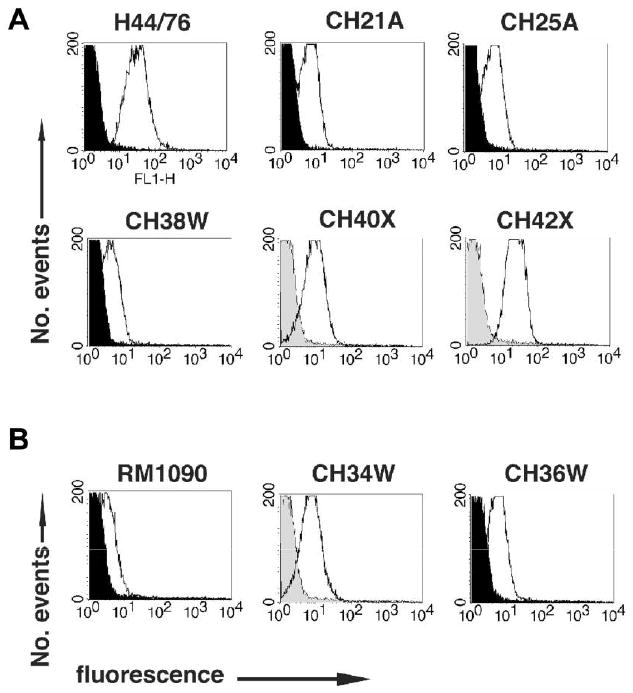
Surface-accessibility of factor H–binding protein (fHbp) on live bacterial cells, as measured by flow cytometry with mouse anti-fHbp variant 1 (v.1) (A) or 2 (v.2) (B) antisera. The H44/76 positive control is known to express high levels of fHbp v.1 [14]. The RM1090 positive control is known to express low levels of fHbp v.2 [21] with 99% amino acid identity to fHbp v.2 of the group W-135 test strains. White and black histograms denote the respective binding of anti-fHbp antisera (1:250) to wild-type and fHbp knockout strains. For strains for which fHbp knockout mutants were not available, the gray histograms denote binding of a 1:50 dilution of a negative control antiserum with the wild-type strain. Strain designations are those shown in table 1.