
Figure 1. Taxol induces a biphasic apoptotic response and increases hypodiploid nuclei in tumor cells (time and dose-dependency).
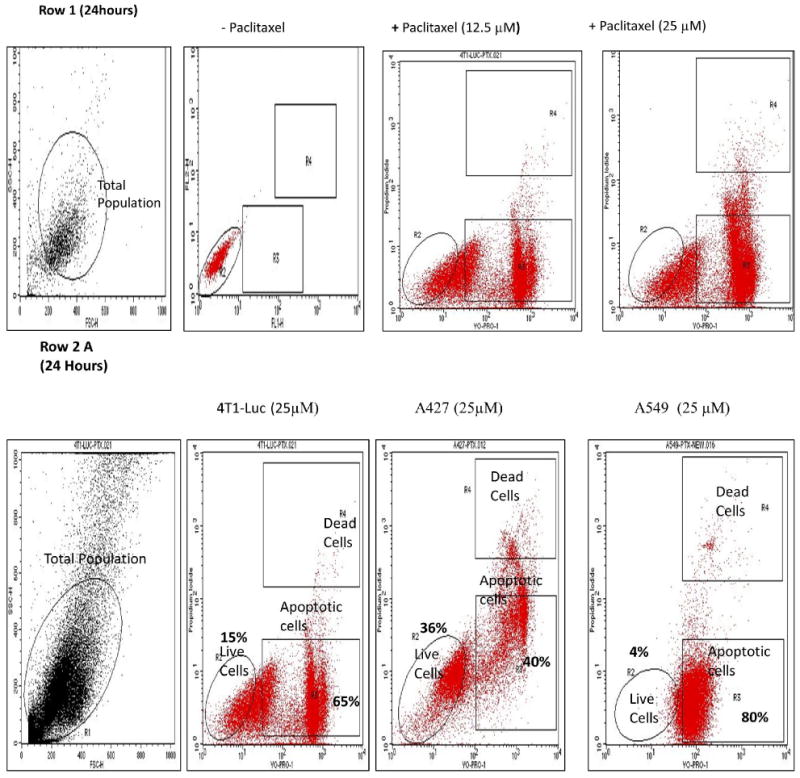
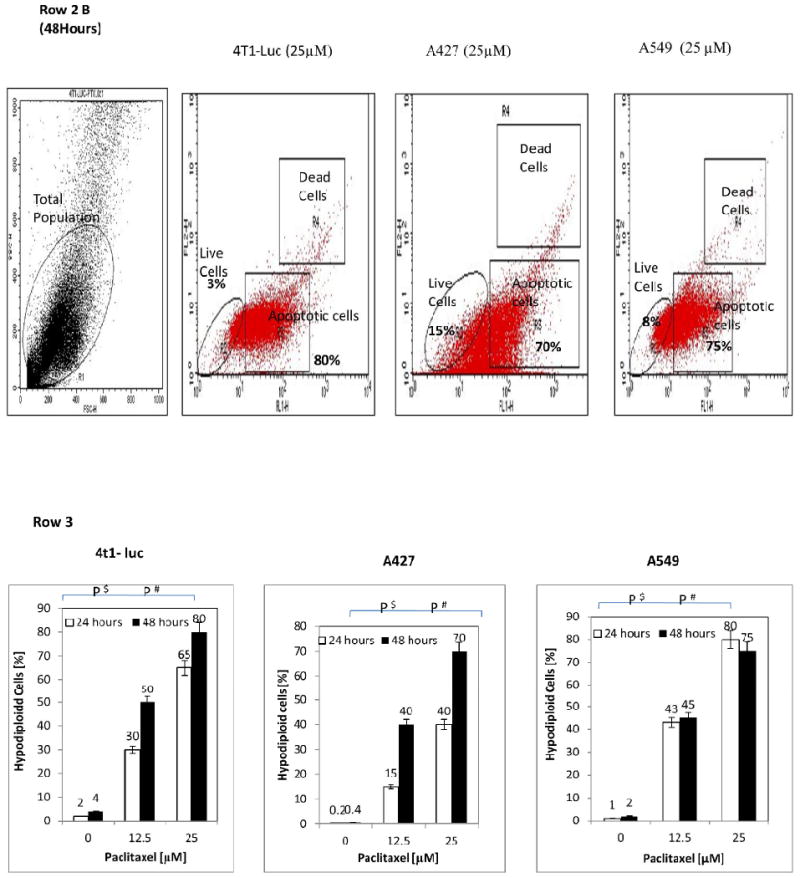
Drug treated cells (1 × 10⁶ cells/ml) were resuspended in buffer and stained by propidium iodide (PI) and YO-PRO® dyes. Nuclei staining by PI and YO-PRO® were analyzed in the FL2H/FL1H channels, respectively, of a FACSCalibur flow cytometer. A laser with 488 nm excitation was used to induce green and red fluorescence emission for YO-PRO® and PI, respectively. Hypodiploid nuclei with the former stain represent apoptotic cells. 20,000 total events were measured for each cell sample. Oval shape represents live cells within total population; top and bottom rectangles represent, dead and apoptotic cells, respectively, of the total population. Row 1: Representative FACS analyses of untreated and treated hypodiploid nuclei indicate taxol-induced apoptosis in cells in time and dose dependent fashion. Row 2: Increase in hypodiploid nuclei is cell specific. Data represents cells treated with 25 μM paclitaxel for 24 h and 48 h. (A) At 24 h the percentage of apoptotic nuclei is highest in A549-cells (80% of total), followed by 4T1-luc (65% of total), and the lowest in A427 cells (40%). (B) At 48 h, the highest percentage of apoptotic nuclei is observed in 4T-1 luc cells (80%), followed by A549 (75%), then A427 (70%). Different pattern of response at 24 h versus 48 h is indicative of an early and late phase of apoptotic response in the tumor cells and underscores different tumor response mechanisms to paclitaxel. Row 3: Comparison between groups treated for 24 h and 48 h with the same and different taxol dose reveal a time and concentration dependent response in tumor cells. The bar diagrams summarize the dose and time response at the indicated concentrations of taxol and show the mean values ± S.D. of hypodiploid nuclei with YO-PRO staining and PI-excluding cells. Statistical analysis was performed using one-way ANOVA/F-test and student's t-test to compare differences between groups. P$< 0.05 – Groups treated with the same concentration but different time points, P# < 0.05 – Groups treated with different concentrations but same time point. At 24 h, 12.5 μM of drug induces a similar response pattern as observed at 25 μM of drug- the higher apoptotic nuclei occurs in A549-cells (43%), followed by 4T1-luc (30%) and the lowest in A427 (15%). However at 48 h, a different response pattern is observed, albeit the differences % in apoptotic nuclei are minor: at 12.5 μM of drug, the highest apoptotic nuclei occurs in 4T1-luc (50%), followed by A549 (45%), and the lowest is observed in A427 (40%). The same response patter occurs at 25 μM: 4T1-Luc (80%), A549 (75%), A427 (70%).