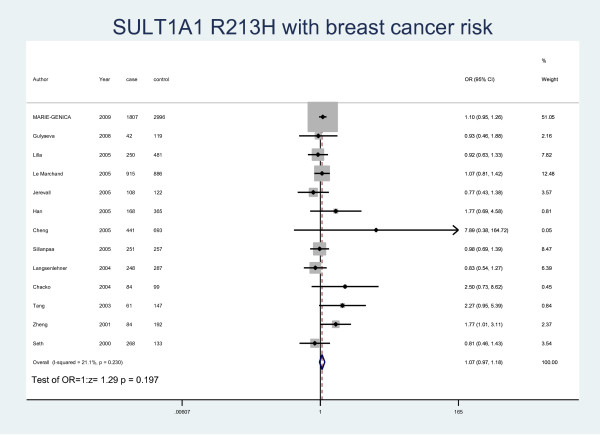
Figure 2.
Forest plot of meta-analysis on the association of SULT1A1 Arg213His with breast cancer risk in all population by Arg/Arg vs His/His model. The size of the square box is proportional to the weight that each study contributes in the meta-analysis. The overall estimate and confidence interval are marked by a diamond. Symbols on the right of the line indicate OR > 1 and symbols on the left of the line indicate OR < 1.

