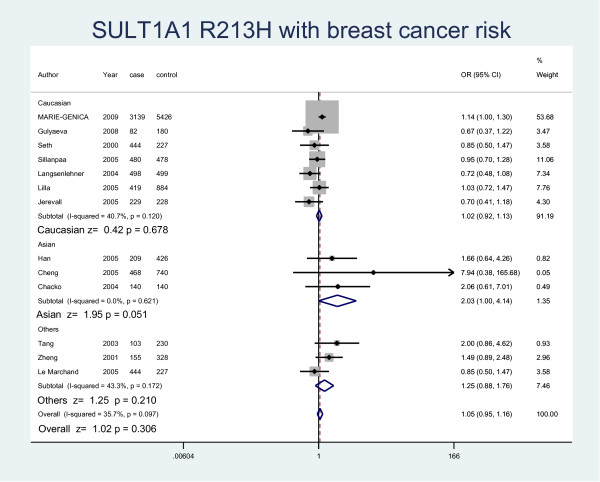
Figure 4.
Forest plot displaying a random-effects meta-analysis on the association of SULT1A1 Arg213His with breast cancer risk by race in the recessive model. The size of the square box is proportional to the weight that each trial contributes in the meta-analysis. The overall estimate and confidence interval are marked by a diamond. Symbols on the right of the line indicate OR > 1 and symbols on the left of the line indicate OR < 1.

