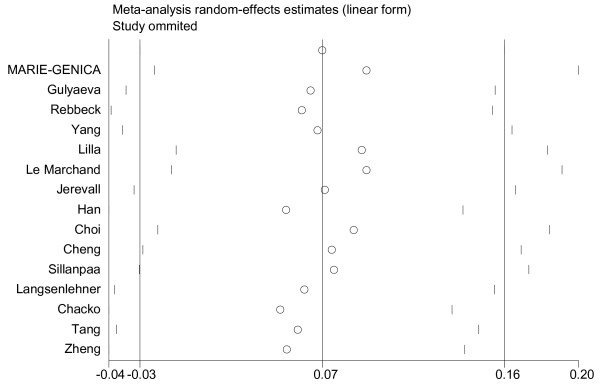
Figure 8.
Sensitivity analyses for the influence of individual studies on the summary effect. Sensitivity analyses for the influence of individual studies on the summary OR. The vertical axis indicates the overall OR and the two vertical axes indicate its 95% CI. Every hollow round indicates the pooled OR when the left study is omitted in this meta-analysis. The two ends of every broken line represent the respective 95% CI.

