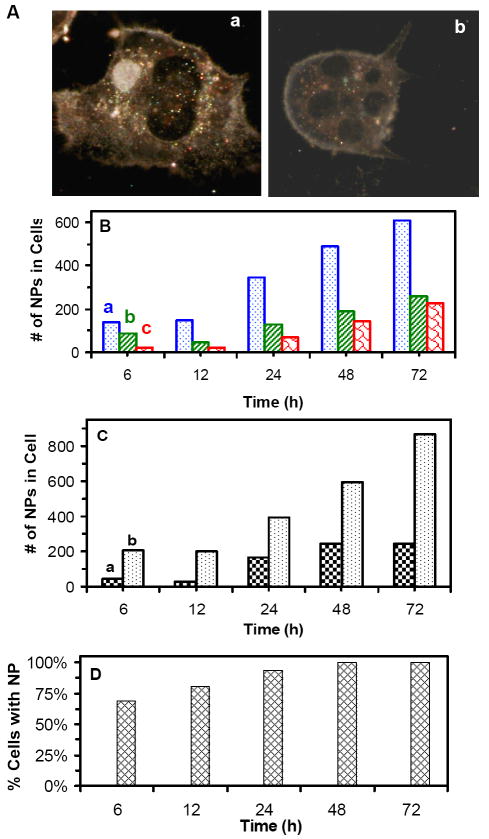
Figure 7.
Imaging and characterization of intracellular single Ag NPs in single living tumor cells:
(A) Optical images of single cells show NPs accumulated in (a) both the cytoplasm and nuclei of the cells, and (b) in the cytoplasm only.
(B) Total number of intracellular (a) blue (5-14 nm), (b) green (14-20 nm) and (c) red (20-32 nm) NPs in 25 cells increases over time.
(C) Total number of intracellular NPs in the (a) nuclei and (b) cytoplasm of 25 cells shows more NPs in the cytoplasm.
(D) Percentage of the cells with NPs versus time shows that it increases with time and the majority of cells, 69%, 81%, 94% and 100% of cells, have NPs at 6, 12, 24, and 48-72 h, respectively.
The cells in (A-D) are cultured on the coverslips in the medium containing 0.46 nM Ag NPs, and imaged at 6, 12, 24, 48, and 72 h, respectively. Total 25 cells at each given time in (B-D) are analyzed. The scale bar in (A) = 20 μm

