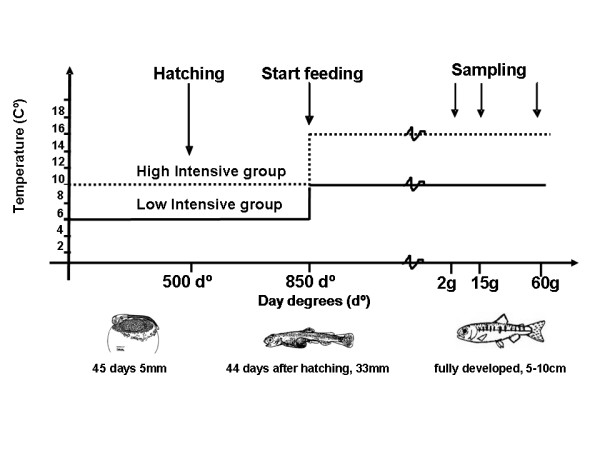
Figure 8.

Experimental overview of the two temperature regimes. Developmental stage is shown along the x-axis and temperature along the y-axis. The low temperature intensive rearing conditions are shown as a black line and the high temperature intensive conditions as a stippled line. Sampling was conducted at 2 g, 15 g and 60 g. Experiment was terminated when the fish reached 60 g.
