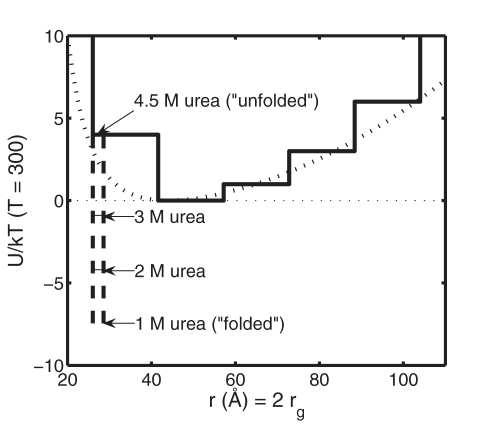
Figure 1. Histogram potential for one-dimensional toy model.
Solid curves: discretized potential acting between two isolated spherical protein “subunits” as a function of the distance between sphere centers (r = rg/2). Solid line: potential in the presence of 4 M urea. Dashed lines: attractive potential in bin 1 (see Table 1) calculated for curea = 1, 2 and 3 M. Dotted curve: continuous potential of mean force as a function of Rg, derived from the distribution of Rg of unfolded states of ribonuclease A calculated by Goldenberg [38] as described in Minton [15].

