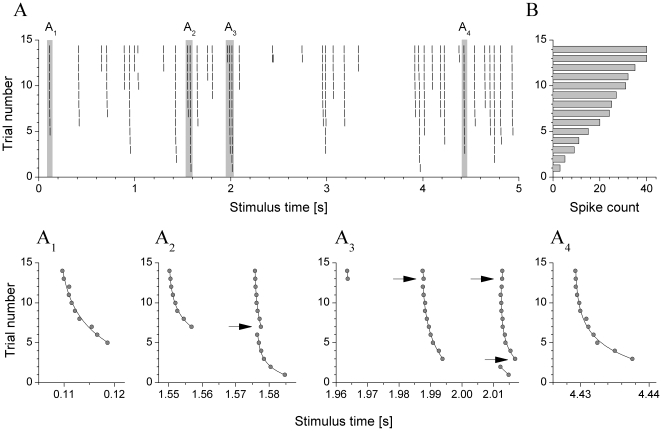
Figure 3. Gradually increasing synaptic inputs leads to an increasing number of spikes and decreasing latency between the pre- and postsynaptic spikes.
(A) Peri-stimulus scatter plot of a type II neuron receiving synaptic inputs with increasing maximal conductance (from 5 nS to 18 nS; trial number 1 to 14, respectively). The spike count in the successive trials increases monotonously (B). Four selected sections (gray bars) of the peri-stimulus plot are displayed below. A1 is an example of a single “clear” spike with exponentially decreasing latency. A2 shows the effect of a new spike in trial #7 which delays the following spike already present in the earlier trials. A3 is similar, but here two new spikes appear in trial #3 and #13, respectively; the delaying effect is weaker when the excitatory synaptic conductance is stronger, i.e. at trial #13 (17 nS). A4 is another example for a “clear” spike with exponentially decreasing latency (like on panel A1).

