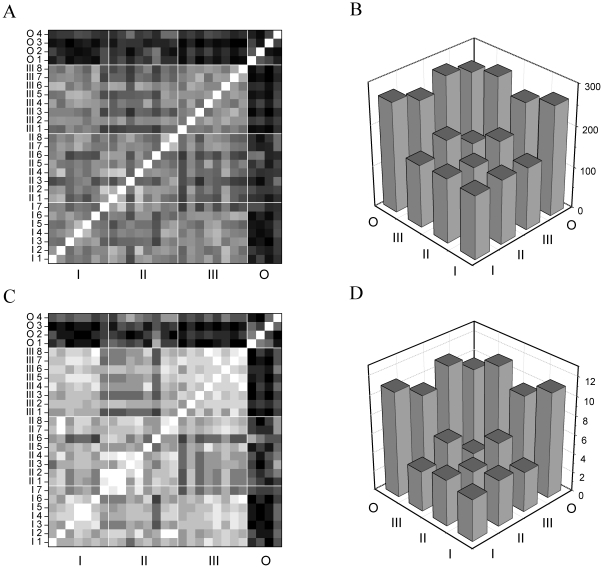
Figure 5. Similarity analysis of spike responses of jcBNST neurons reveals slight differences across cell types.
Grayscale-coded matrices demonstrate pairwise spike train distances calculated from the responses of 27 neurons. The neurons were grouped into four clusters (types I, II, III and O for oscillatory) as defined by their responses to rectangular current stimulation. Panel A shows pairwise distances obtained from the absolute differences between the PSDFs (method 1). C is the result of the peak match counting (method 2). Average pairwise distances within groups and between groups are not significantly different, however, cell type III neurons within the group appear to produce more similar spike responses than others (III/III field is the brightest). Also, the average distance between type II and III neurons exceeds those between the I/II or I/III types. Panels B and D display the average distance values within the main partitions of the matrices (line of identity not included). The new oscillatory type neurons display firing patterns that are dramatically different from those of the other types of neurons.

