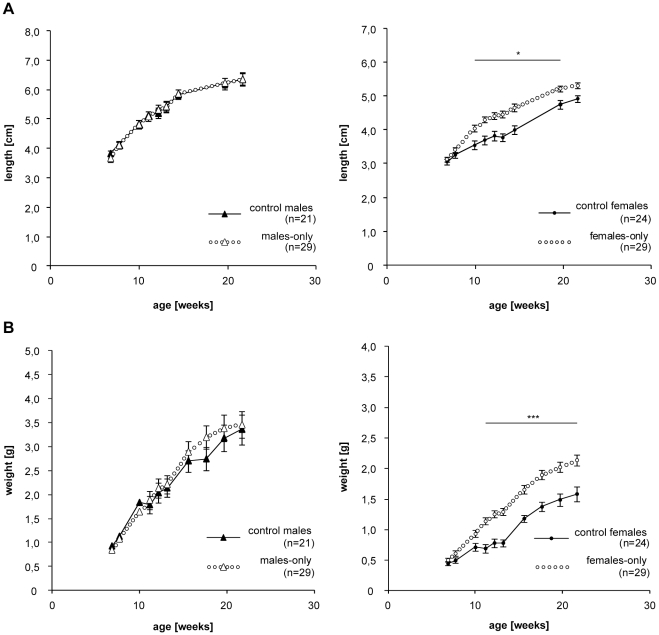
Figure 2. Age dependent changes in mean body weight and size in gender separated and control animals.
Determination of length (A) and body weight (B) of males-only and control males (left) and females-only and control females (right). Graphs show mean ± sem. Significance for given data points were calculated by Bonferroni post hoc test.

