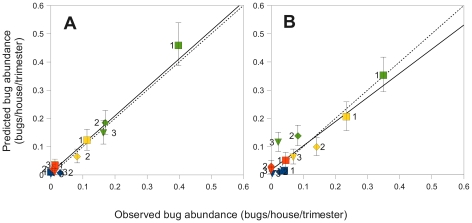
Figure 3. Correlation between observed and predicted bug abundance in the village of Teya, Yucatan, Mexico.
(A) Descriptive value of the model as indicated by the relationship between predicted values and abundance data during the first year of field collections that were used to estimate the model parameters. (B) Predictive value of the model given by the relationship between predicted values and the abundance data during the second year of field collections. Total bug abundance observed in the houses and estimated in the model were pooled over 3-months periods (starting in mid-September 2006) and within three distance categories: 0–80 m, 81–200 m and >200 m from the bush area outside the villages. The 95% confidence intervals correspond to the variations in bug abundance obtained in the 1,000 stochastic simulations performed to fit the model to the data. Predicted abundance = 0.008+1.009 * Observed abundance year 1 (McFadden's likelihood ratio index = 0.919). Predicted abundance = 0.019+0.854 * Observed abundance year 2 (McFadden's likelihood ratio index = 0.750). The straight and dotted lines correspond to the above regression lines and 1∼1 relationship, i.e., a perfect fit. Squares, diamonds and triangles stand for the mean abundance predicted in the three following spatial areas: 0–80 m, 81–200 m and >200 m from the bush area outside the villages. Green symbols stand for the ‘immigration period’, which corresponded to March16–June 15 in year 1, and delayed by 15 days in year 2 (because immigration started latter during this second year). Yellow, orange and blue symbols stand for the three following consecutive periods of time during the year. Labels ‘1’, ‘2’, and ‘3’ have the same meaning as squares, diamonds and triangles and are added to ease the reading of colourless printings.

