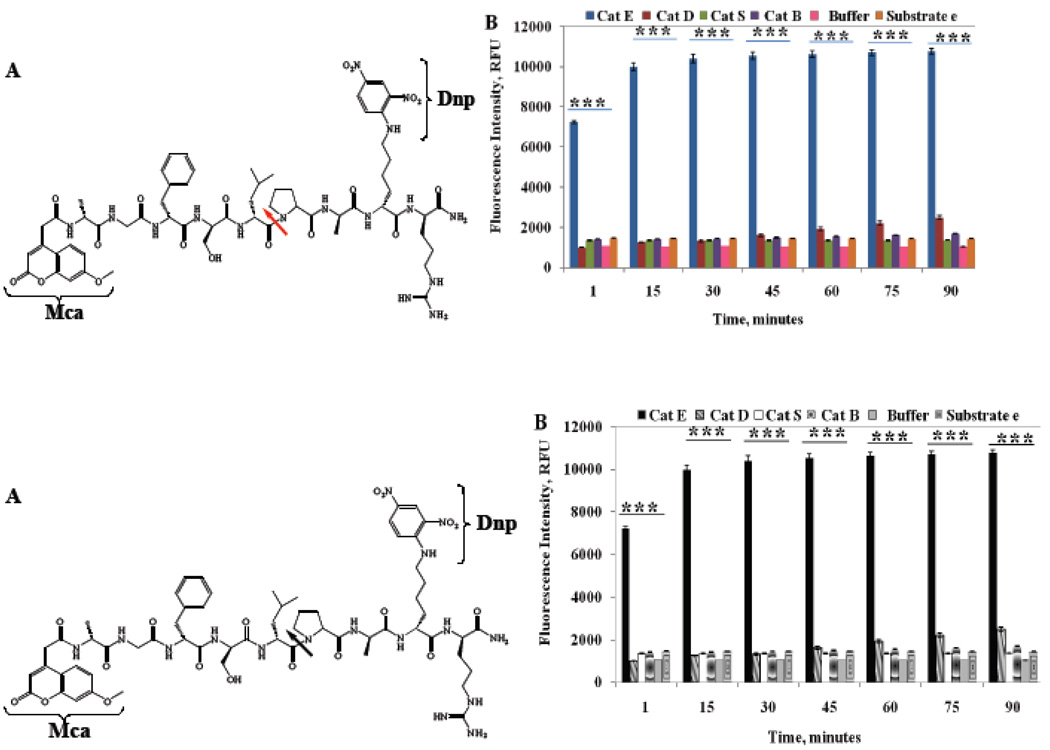
Figure 3.
(A) Structure of intramolecular quenched substrate e, Mca-Ala-Gly-Phe-Ser-Leu**Pro-Ala-Lys(Dnp)-D-Arg-CONH2; (B) Change in the fluorescence intensity of substrate e (200 µM) during the incubation with 23 picomole of Cath E, Cath D, Cath S and Cath B in 50 mM NaOAc buffer of pH 4.0 for Cath E and D and 100 mM NaOAc buffer of pH 6.5 for Cath S and Cath B. Values represent the mean of at least three independent experiments. Error bars represent the upper and lower values of the Standard Error Mean (SEM). Asterisks represent the statistical significance of the two tailed P-values (***, P ≤ 0.001).

