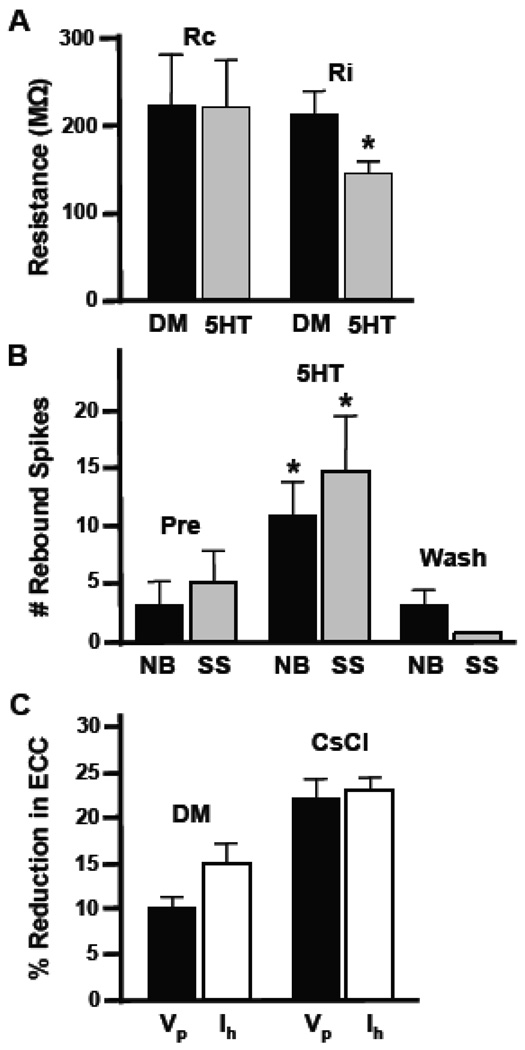
Figure 4.
Mechanism of neurotransmitter-induced reductions in coupling. (A) Histogram showing alterations in input resistance (Ri), but not coupling resistance (Rc) caused by treatment of neurons with 50µM 5HT. Ri was significantly reduced (*, p<0.03; n=12), while no change in coupling resistance was calculated (p=0.49). (B) Histogram illustrates post-inhibitory rebound (PIR) in 19-19 pairs during bath application of 50 µM 5HT. PIR was increased in both neurite-bearing (NB, n=17; p<0.005) and soma-soma 19-19 pairs (SS, n=6; p<0.005). These effects were reversed upon washout. (C) Coupling coefficients were calculated during hyperpolarizing current injection at early, peak voltage changes (Vp) as well as at later time points during the “sag” (Ih). Bars on the left (DM) show the normalized percent reduction in electrical coupling coefficient (ECC) induced by 5HT at both time points in the same preparations (n=11; p=0.23). The culture medium in this experiment contained only defined medium (DM). Bars on the right represent data from an experiment conducted in medium containing 5 mM CsCl to block Ih (CsCl).

