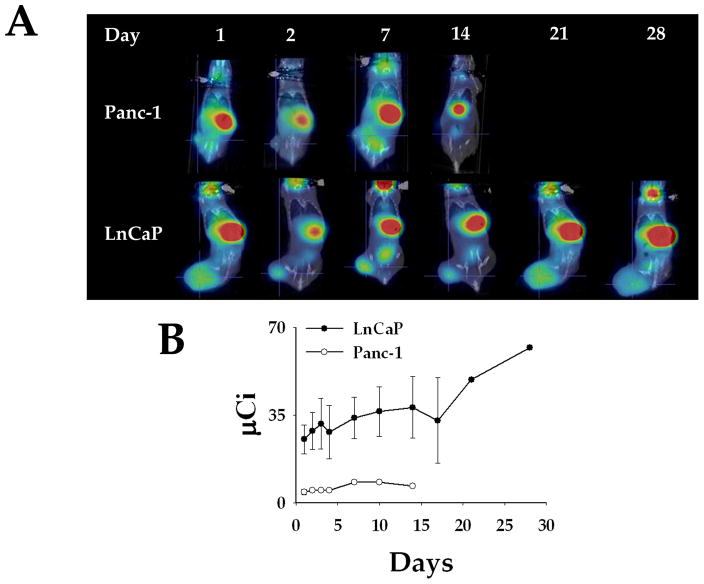
FIGURE 4. Radioiodine Imaging of Xenograft Tumors.
A) LnCaP and Panc-1 xenografted tumors were infected with Ad5PB_RSV-NIS at 1011 vp. At time points post-infection an injection of 0.5 mCi 99Tc was given IP to all mice. Images were captured using a noninvasive micro SPECT-CT imaging system one hour after radioisotope administration. B) Kinetics of imaging were established by quantifying 99Tc tumor uptake using the PMOD Biomedical Image Quantification and Kinetic Modeling Software (PMOD Technologies, Switzerland). The level of 99Tc uptake by the tumor was expressed as tumor activity in μCi.

