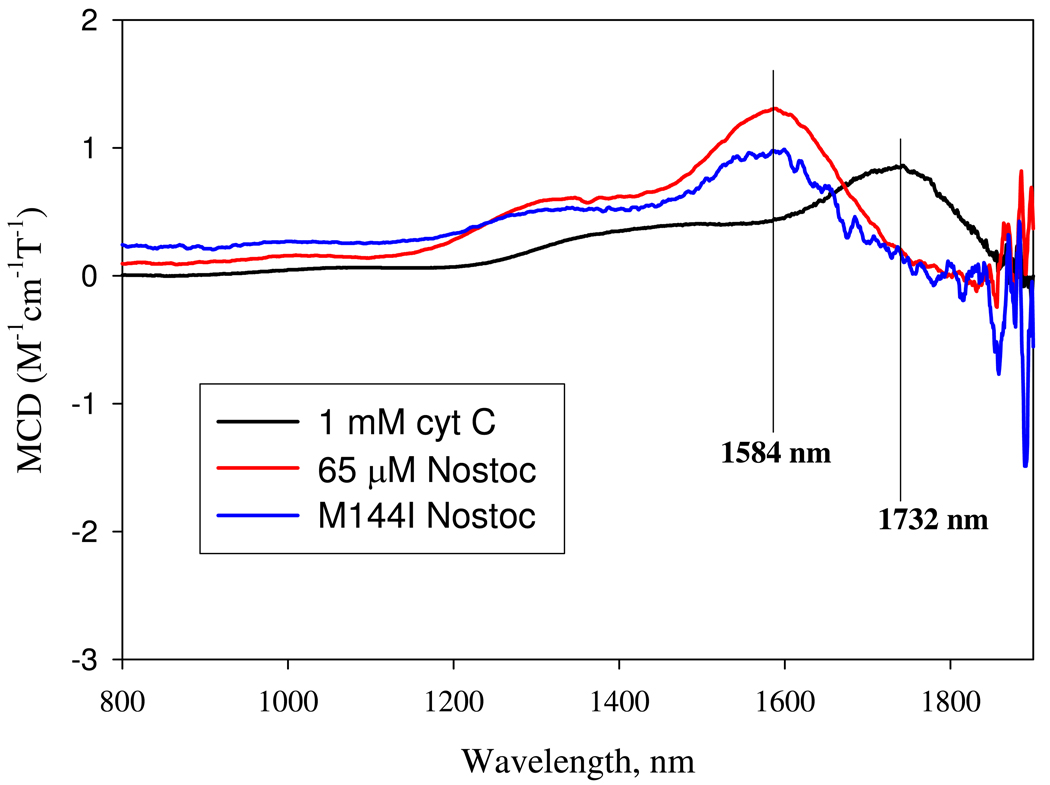
Figure 10.
Identification of the axial heme ligands of ferric Ns H-NOX by NIR MCD. Same three samples used for EPR measurements in Fig. 9 were used in the NIR MCD measurements in the range from 800 to 2000 nm at 24 °C. All samples were prepared in D2O 50 mM HEPES, pH 7.4 to minimize the NIR MCD overtone background signals from the water solvent (34). MCD conditions are described in the Methods and the spectrum for cytochrome c was obtained as one scan while that of wild type and M144I Ns H-NOX were an average of 8 scans. The wavelengths of the main transitions are labeled for each sample. These marker wavelengths (nm), or energy levels are used to identify the axial ligand pairs from the correlation diagram composed for a series of low-spin hemeproteins with two axial ligands (34).

