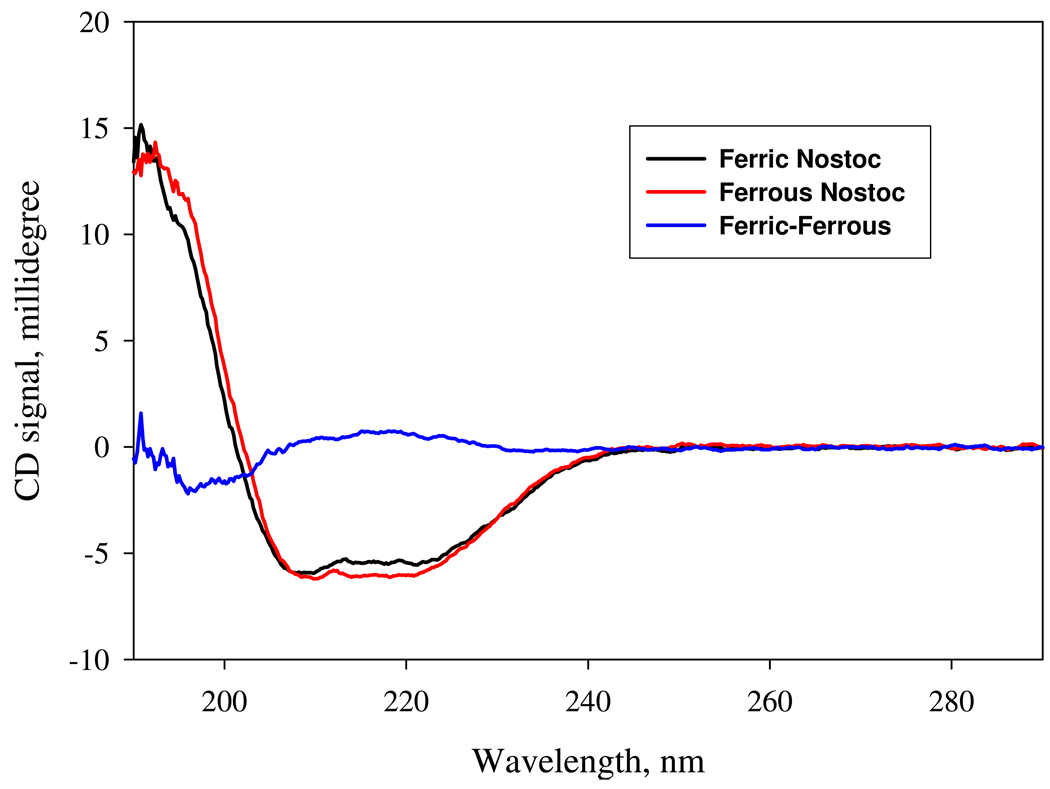
Figure 11.
Far-UV CD of the ferric and ferrous Ns H-NOX. Both the ferrous and ferric sensor proteins were prepared as 1 µM in 2 mM HEPES containing 2 mM NaCl and 0.1 % glycerol, pH 7.7 by either dithionite or ferricyanide pre-treatment, respectively, and then gel-filtered in the same HEPES buffer to remove excess reductant or oxidant. CD measurements were conducted as described in the Experimental Procedures. The data shown for the ferric (black), ferrous (red) sensor are 12-scan average corrected for background signal originated from buffer alone and the difference spectrum (blue) is obtained by subtracting the CD spectrum of the ferrous sensor from that of the ferric form.

