
Fig. 2.
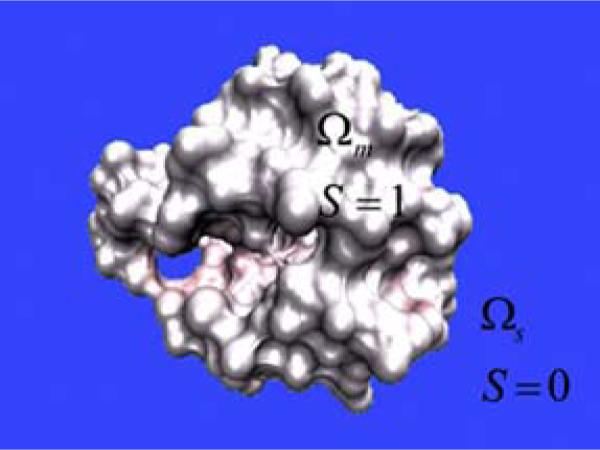
An illustration of the macromolecule and its aquatic environment. The macromolecular domain (Ωm) and its hypersurface function value S = 1 are indicated on protein 451c. Similarly, the aqueous domain (Ωs) and its hypersurface function value S = 0 are indicated on the background.