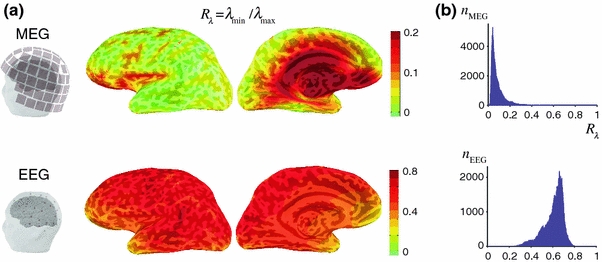
Fig. 1.

Distribution of R λ, measuring the relative sensitivity to sources of different orientation and calculated as the ratio of the smallest and largest singular values of the dipole gain matrix for MEG (top) and EEG (bottom). a Spatial maps of R λ for the left hemisphere are shown in a lateral and medial view of an inflated representation of the cerebral cortex. The curvature of the cortex is indicated by darker (sulci) and lighter (gyri) regions through the semi-transparent color-coded map of R λ. Note the different color scales for MEG and EEG. The location of the MEG sensors and EEG electrodes with respect to the cortical surface and the scalp are shown on the left. b Histograms of the R λ values across all locations on the cortex, showing the number of vertices for MEG and EEG (n MEG, n EEG) with a given value of R λ
