
Fig. 2.
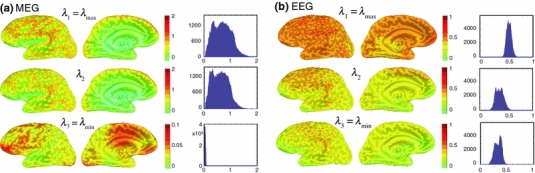
Distribution of the sensitivity to three orthogonal source components at each location on the cortex, indicated by the singular values (λ k,1 = λ k,max, λ k,2, λ k,3 = λ k,min) of the dipole gain matrix A k for MEG (a) and EEG (b). Note that for MEG, the color scales in the spatial map and the vertical scales in the histogram are different for the singular value for the orientation of the lowest sensitivity (λ k,3) from those for λ k,1 and λ k,2. The units for λ k,i are pT/nAm for MEG and μV/nAm for EEG