Figure 5.
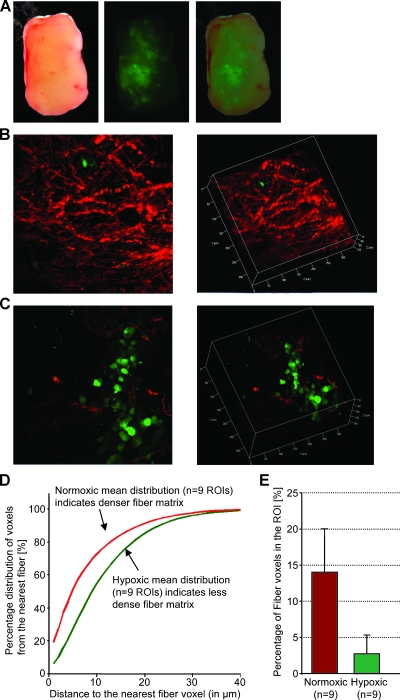
Consistent with Figure 2, hypoxic regions are heterogeneously distributed throughout solid PC-3 tumors as evident in a representative set of (A) bright-field, green fluorescence, and overlay microscopic images (left to right) of a fresh 2-mm-thick section from a solid PC-3-5HRE-EGFP prostate tumor. Representative SHG Col1 fiber (red) and hypoxia (green) images are from (B) a normoxic and (C) a hypoxic FOV, displayed as z-projection (left) and as three-dimensionally reconstructed image (right). We computed (D) the mean distance distribution to the nearest fiber voxel as a measure of fiber density and (E) the percentage of fiber voxels within the ROI (mean ± SD). Data are from three tumors. Hypoxic regions had more than 80%, and normoxic regions had less than 1% of hypoxic EGFP-expressing cells in the ROI. Hypoxic tumor regions contained less dense and fewer Col1 fibers than normoxic regions in PC-3 prostate tumor xenografts stably expressing HRE-EGFP.

