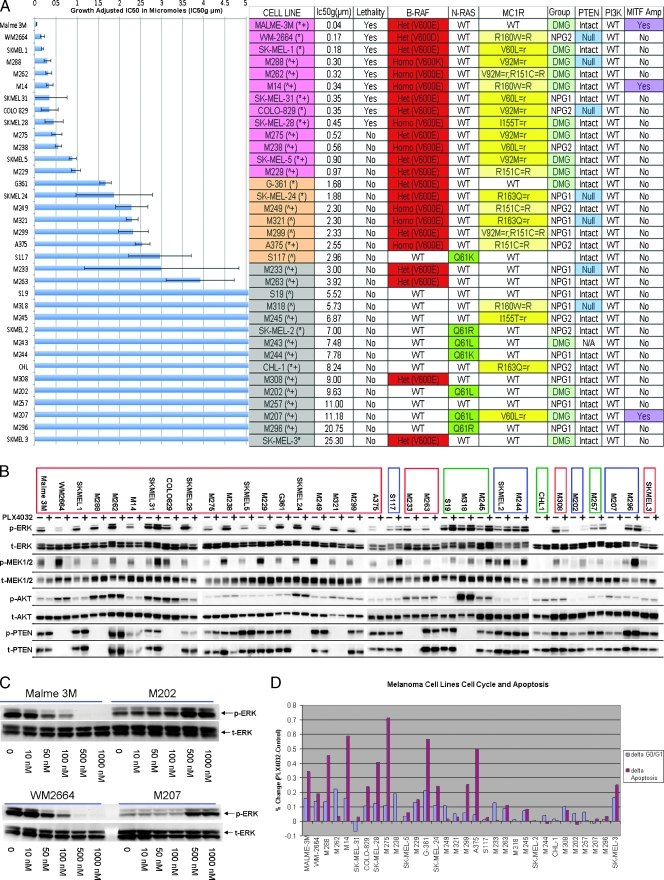
Figure 1.
Functional activity of PLX4032. (A) Growth inhibition assay of MM cell lines (n = 35) after exposure to PLX4032. The concentration of drug in micromolars that achieves a growth adjusted inhibitory concentration of 50% (IC50g µM) (x-axis), melanoma cell line (y-axis). SE is depicted. Table outlines characteristics of the 35 MM cell lines. Order of cell lines corresponds to the growth inhibition chart. Cell lines are color coordinated based on response (pink—clear sensitivity, orange—intermediate sensitivity, gray—resistant). In parenthesis next to the cell line: *cells were purchased from ATCC or ^developed from tumor samples at UCLA (University California, Los Angeles), +cell lines that were included in the complementary RNA mixed reference pool for the microarray analysis. Lethality = cell death in addition to growth inhibition. BRAF and NRAS status with specific amino acid substitutions; MC1R germ line status/gene polymorphism; R versus r describes the functional effect of MC1R variant/relation to skin pigmentation [3]. Gene expression groupings: DMG = differentiated melanocyte group, NPG = neuronal precursor group. PTEN and PI3K status: presence of MITF amplification as determined by focal in situ hybridization (>2 genes per chromosome 3 centromeres). (B) Phosphoprotein signaling of MM cell lines through Western blot analysis before and after exposure to PLX4032. Cell lines are listed in order of sensitivity. Composite arrangement of multiple Western blots is depicted by dividing lines. BRAFm cell lines are outlined in a red box; NRASm, blue; and BRAFwt/NRASwt, green. (C) Western blot analysis of two BRAFm (Malme3M and WM2664) and two NRASm (M202 and M207) MM cell lines after exposure to increasing concentrations of PLX4032. (D) Cell cycle and apoptosis assays as done by flow cytometry. Chart depicts percent change in the number of cells in G0/1 (blue bar) and the number of cells in apoptosis (maroon bar) of the treated cell line versus the untreated control.

