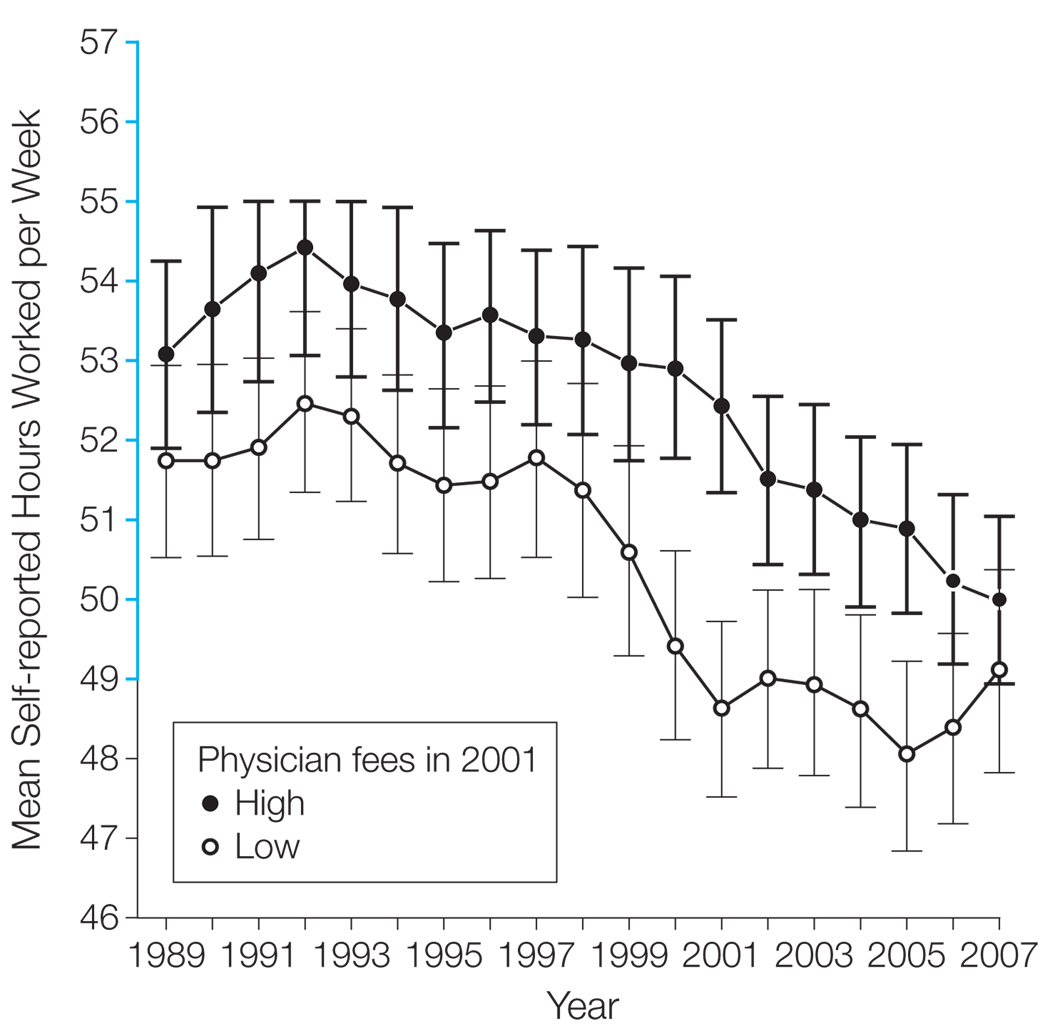
Figure 4. Mean Self-reported Hours Worked per Week by Physicians in Metropolitan Statistical Areas (MSAs) With High and Low Physician Fees in 2001.
Current Population Survey (CPS) data based on hours worked in the previous week. Data represent 3-year moving averages for each year plotted (eg, 1989 represents 1988–1990 and 2007 represents 2006–2008) and are weighted using sampling weights. Error bars indicate 95% confidence intervals. Physicians were designated as living in a low-fee (vs high-fee) MSA if the Government Accountability Office fee index from 2001 in their MSA was below the median in our sample. Years before 1989 are excluded because MSA is not consistently identified before 1989 in the CPS data. The blue portion of the y-axis indicates 49 to 57 self-reported hours worked per week, the range for all physicians (Figure 1).

