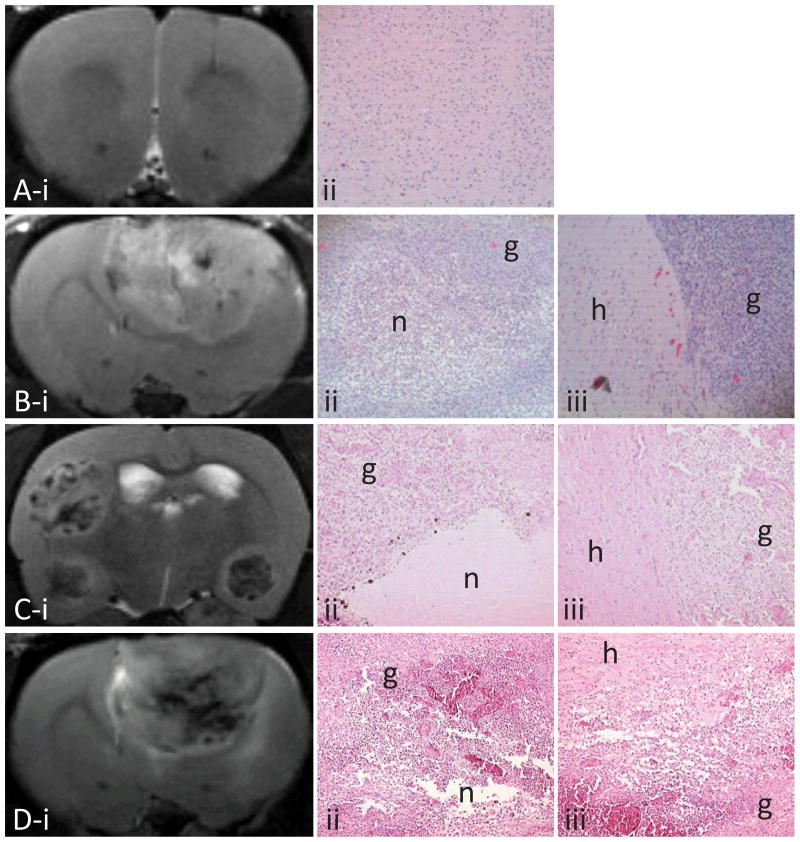
Figure 1.
Representative T2-weighted images taken at various days after cell implantation (panel i) and corresponding H&E (x 10) showing necrotic (n, for areas of very low or null glioma cell density) and glioma tissue (g, ii) and the peritumoral region (healthy tissue, h, iii): rat injected with primary astrocytes at day 21 (A), C6 glioma at day 18 (B), ENU glioma at week 34 (C) and RG2 glioma at day 17 (D).

