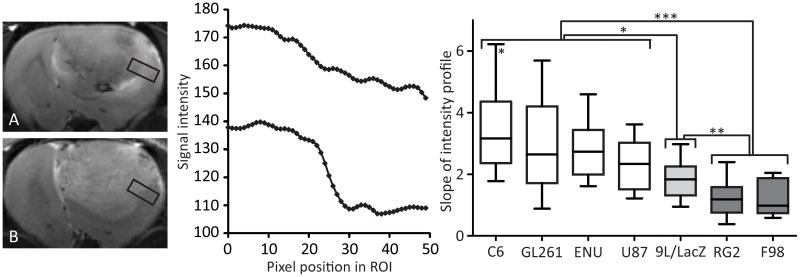
Figure 2.
T2-weighted images of a RG2 (panel A) and C6 (panel B) gliomas, with corresponding pixel intensity profiles taken in the peritumoral region (a ROI is shown as a black rectangle). The slope between C6 tumor (high-intensity pixels) and healthy (lower intensity pixels) tissue is sharp (bottom), whereas an infiltrative RG2 glioma presents a more gradual intensity change (top). Panel C represents the slopes of the intensity profiles for each glioma model, calculated at the last MRI time point (about 23 days after cell implantation for the orthotopic implantation models and at 30 weeks of age for the ENU induction model). The data are represented as 10–90 percentile. (*) p < 0.05 between any glioma from the “white” group and the 9L/LacZ model, and between the C6 and the U87 models; (**) p < 0.01 between 9L/LacZ tumors and the tumors from the “dark grey” group; (***) p < 0.001 between the “white” and the “dark grey” groups.

