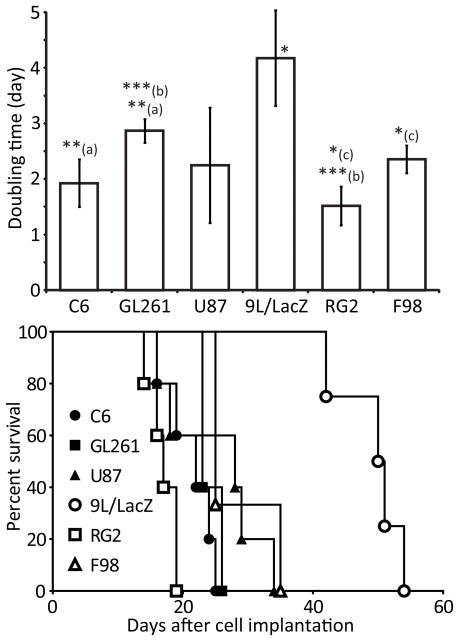
Figure 3.
Time needed by each glioma model to double in size (top) and survival curves of each group (bottom). The doubling time data are represented as the mean ± standard deviation. * p < 0.05 between the 9L/LacZ tumors and all other models, and between (c) the RG2 and the F98 gliomas; **(a) p < 0.01 between the C6 and the GL261 models; ***(b) p < 0.001 between the GL261 and the RG2 models. For the survival data, * p < 0.05 between the F98 and the C6 models, and between the F98 and the RG2 tumors; ** p < 0.01 between the 9L/LacZ gliomas and all other models.

