
Figure 3.
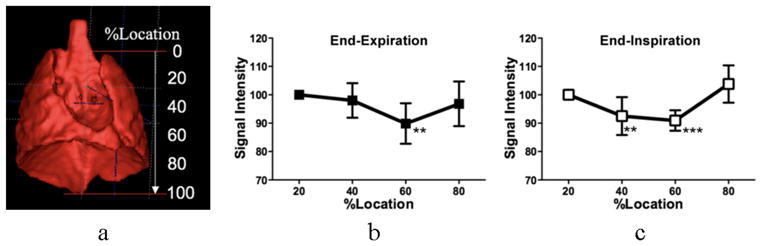
Typical volume rendering image of a thoracic cavity in a mouse indicating locations of the SI measurement (a), which was generated from a three dimensional UTE image. Location difference in SI of the lung parenchyma in the WT group at end-expiratory (b) and end-inspiratory (c) phases are shown. Data are expressed as averaged changes between right and left lungs relative to 20% location (from apex) in each respiration and represent mean ± standard deviation. ** P < 0.01; *** P < 0.001 by the Dannett multi-comparison test following ANOVA.