
Figure 5.
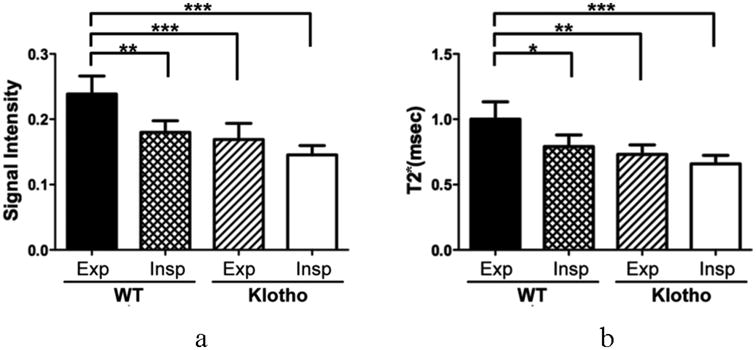
Corrected SI at the TE of 100 μsec (relative to the phantom; a) and T2* (b) at end-expiratory and end-inspiratory phases in the WT and klotho groups. Both values are lower at end-inspiratory phase in the WT. The klotho mice revealed reduced SI (P < 0.001) and T2* (P < 0.01) compared to those in the WT mice. Data are expressed as mean ± SD. * P < 0.05; ** P < 0.01; *** P < 0.001 by the Tukey multi-comparison test following ANOVA.