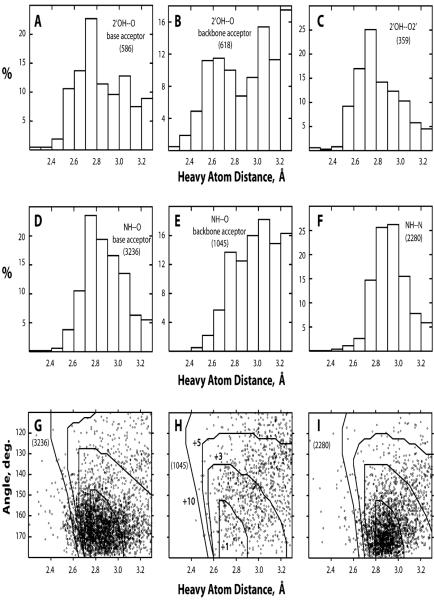
Fig. 1.
Histograms of H-bond heavy atom distances (A–F) and scatter plots of H-bond angle versus heavy atom distance (G–I). The histograms are shown for BH-bonds 2′OH–O with nucleobase acceptors (A) and backbone acceptors excluding O2′ (B), BH-bonds 2′OH–O2′ (C), H-bonds NH–O with nucleobase acceptors (D), BH-bonds NH–O with backbone acceptors (E), and H-bonds NH–N (F). The scatter plots are shown for H-bonds NH–O with nucleobase acceptors (G), BH-bonds NH–O with backbone acceptors (H), and H-bonds NH–N (I). Superimposed on the scatter plots are the lines of equal energy calculated for isolated H-bonds. The energy increments relative to the H-bond with the optimal geometry are +1, +3, +5, and +10 kcal mol−1 for the four lines, respectively; the energy labels are shown only in H for clarity. In each case, the total number of relevant H-bonds is shown in parentheses.

