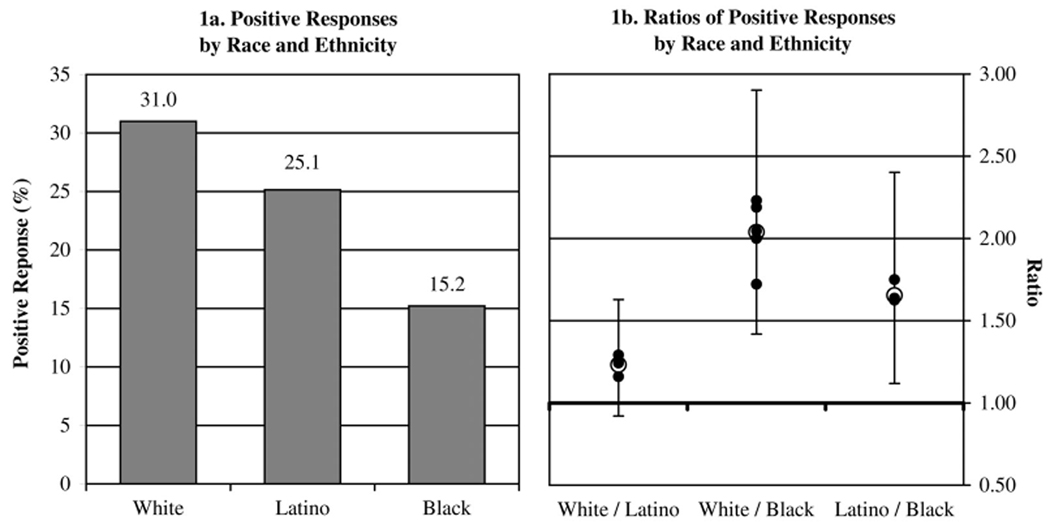
Figure 1.
Positive Response Rates and Paired Comparisons by Race and Ethnicity
Notes:Positive responses refer to callbacks or job offers. Hollow circles in Figure 1b indicate point estimates of the ratio. Solid circles indicate ratios obtained by sequentially dropping testers from the analysis. We estimated 95 percent confidence intervals from a hierarchical logistic regression with employer and tester random effects. Number of employers = 171.

