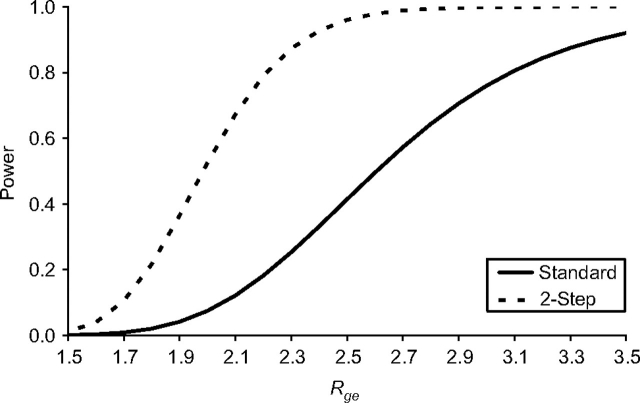
Figure 1.
Statistical power to detect a gene × environment interaction in a genome-wide screen for varying magnitudes of the true interaction effect (Rge). Power for the 2-step method is shown at the optimal setting of α1. All other parameter values are set to those in the base model (see footnote “a” of Table 1).

