
Figure 2. Synchrony in spontaneous complex spike activity.
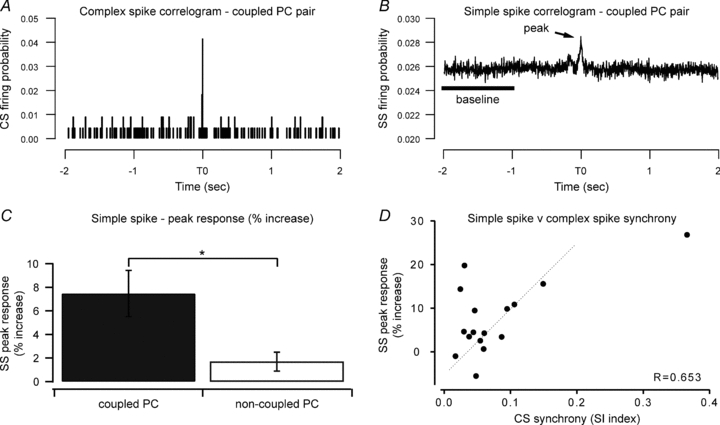
A, cross-correlogram of spontaneous complex spike activity from one coupled PC pair. A peak in the cross-correlogram at time zero indicates synchrony in the complex spike activity of these two cells (synchrony index, SI = 0.095). B, cross-correlogram of spontaneous simple spike activity from the same PC pair as shown in A. For this coupled PC pair there was a 9.9% increase in the correlogram peak (at time zero) above baseline level. C, mean (±s.e.m.) percentage change in peak probability of spontaneous simple spike activity for coupled and non-coupled pairs. *P < 0.005. D, individual data points of the peak responses from the simple spike cross-correlograms (% increase over baseline) plotted against complex spike synchrony index for coupled PC pairs only. There was a significant correlation between the level of simple spike and complex spike synchrony.