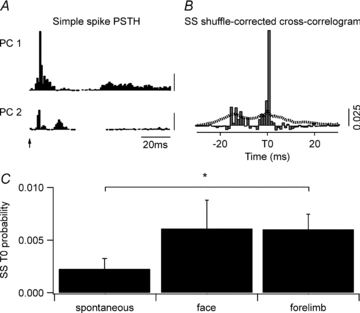
Figure 6. Simple spike synchrony during peripheral stimulation.

A, simple spike (SS) PSTHs for two PCs from one coupled pair in response to face stimulation (1180 trials, stimulus at arrow). Simple spikes within the 0–100 ms time window were used for the subsequent cross-correlogram analysis (scale bar 0.025 probability). B, shuffle-corrected cross-correlogram (1 ms bins) of the data shown in A. Dotted line indicates 99% confidence level. C, mean size (±s.e.m.) of the time zero correlogram peaks for spontaneous simple spike activity and for simple spike activity evoked following face and forelimb stimulation for all coupled PC pairs (n= 17). *P < 0.05.
