
Figure 3. Modulation of MEPs prior to dorsiflexion and plantar flexion.
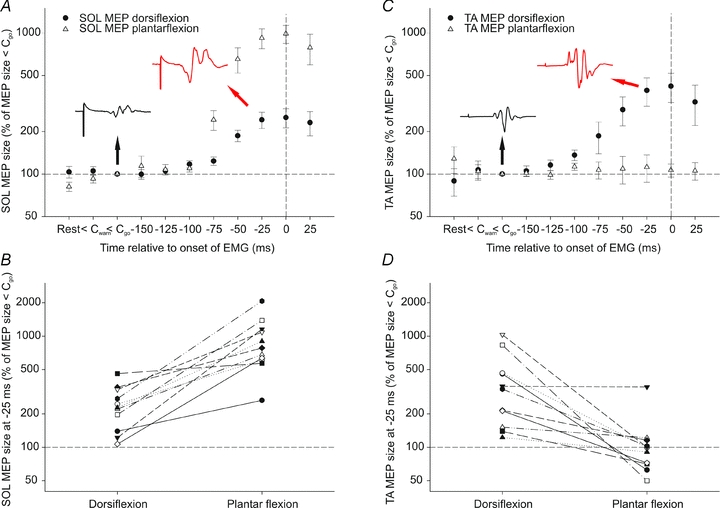
A, average soleus MEP size at rest, < Cwarning, <Cgo and at 25 ms intervals leading up to plantar flexion (▵) and dorsiflexion (•) as a percentage of MEP size at <Cgo (n= 11). The black and red insets are average responses to TMS measured in soleus in one subject at <Cgo (1.9% of Mmax) and at 25 ms prior to dorsiflexion (4.3% of Mmax), respectively. B, size of soleus MEP at 25 ms prior to dorsiflexion and plantar flexion for each subject as a percentage of MEP size at <Cgo. C, like in A, but here TA MEP data are plotted. The black and red insets are average responses to TMS measured in TA in one subject in a soleus experiment at <Cgo (17.8% of Mmax) and at 25 ms prior to dorsiflexion (34.3% of Mmax), respectively. Note the different shape of TA responses compared to the soleus responses in A. These responses were evoked by the same stimulus in the same session. D, size of TA MEP at 25 ms prior to dorsiflexion and plantar flexion for each subject as a percentage of MEP size at <Cgo.