
Figure 3. Left ventricular papillary muscle developed and resting length–tension curves obtained from Con (○), Iso (▴), Ex (•) and Iso+Ex groups (▵) as described in the Methods.
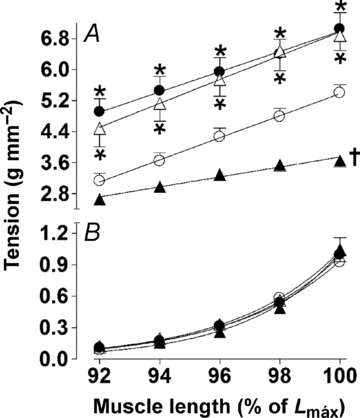
A, straight lines were fitted to the developed length–tension relationships using linear regression analysis. The resulting mean slopes, corresponding to developed tension, were compared between groups. ANOVA and post hoc Newman–Keuls test were used for multiple comparisons. *P < 0.01 when the developed tension was compared with Con and Iso groups for each stretching, †P < 0.001 when slope was compared with other groups. B, the resting length–tension curves for the four groups were fitted to monoexponential non-linear relationships. The resulting means β1 corresponded to resting tension were compared between groups.